From Sidewalk to Dataset: Five Low-Cost Field Protocols for Students
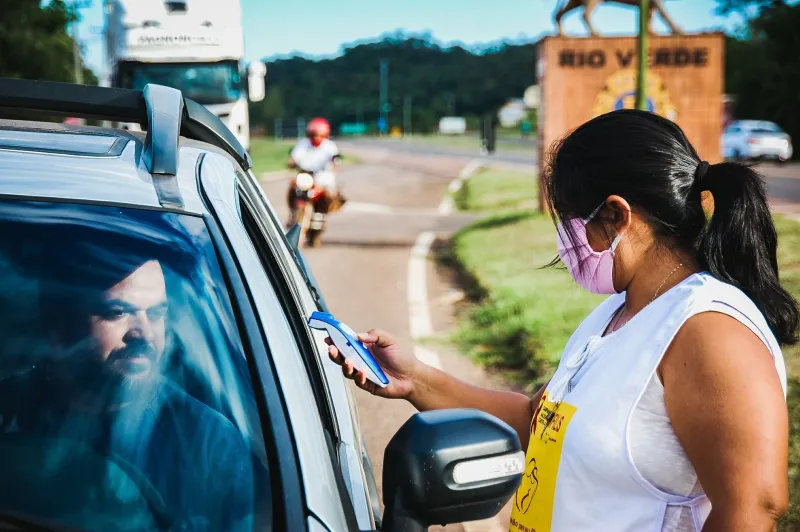
Field courses do not always need a distant forest or a coastal station. In many US cities, a single block contains measurable gradients in surface temperature, sound, particulate matter, foot traffic, and shade. These five protocols are designed for students and instructors who want to turn a sidewalk into a temporary field site without pretending that a phone is a regulatory-grade instrument. The aim is to teach design, replication, and honest reporting. Local measurements become more useful when they are paired with public regional datasets and when the limits of the methods are stated plainly.
Protocol 1: Heat-island transect
Question: How much does surface temperature vary across pavement, grass, shade, and building materials?
Materials: A calibrated infrared thermometer, a phone with GPS, a notebook, water, and a sun-protection plan.
Protocol: Select ten to fifteen points along one block, including asphalt, concrete, lawn, tree shade, a bus stop, and a building facade. Measure surface temperature from a fixed height at each point. Repeat the route three times in the early afternoon and, if possible, once near sunset. Record air temperature, cloud cover, wind, and recent rainfall. Report averages and ranges rather than a single reading.
Connect to regional data: Compare the class transect with the EPA Heat Island Effect resources and local National Weather Service summaries. A nearby airport or university weather station can provide context.
Safety: Check the heat index before starting. Avoid touching hot surfaces, carry water, and keep the group out of roadways. Do not block building entrances or accessible paths.
Protocol 2: Noise walk
Question: Where does sound intensity change along a block, and how does traffic affect the pattern?
Materials: A phone with a sound-level application, an optional external microphone, a clipboard, and hearing protection for unexpectedly loud locations.
Protocol: Choose five fixed points, such as a crosswalk, a cafe entrance, a park edge, a loading zone, and a residential stretch. At each point, record one-minute average readings three times. Log the time, traffic volume, nearby construction, and whether a bus or truck passed. Treat the results as relative comparisons, not as compliance measurements.
Connect to regional data: Compare with state department of transportation noise maps, city 311 records, and local planning documents. These sources can explain why one corner is consistently louder.
Safety: Stand well away from traffic and never enter a roadway to measure. Use hearing protection if readings are high. Avoid confrontations with drivers or bystanders.
Protocol 3: Air-quality micro-survey
Question: How do particulate matter readings vary near intersections, parks, and idling zones?
Materials: A low-cost particulate sensor, a phone, a stopwatch, and a wind indicator such as a ribbon.
Protocol: Select five to seven points on a short route. Take five-minute averages at each point during a morning rush period and again during a quieter period. Record weather, wind direction, and obvious sources such as idling trucks or construction. Repeat the route on a second day to estimate variability. Do not present the results as official air-quality monitoring.
Connect to regional data: Check the EPA's AirNow system before and during the activity. Local Clean Air Act monitoring sites and city sustainability offices may also publish summaries.
Safety: Cancel or relocate the activity when air-quality alerts are in effect. Avoid strenuous exertion, keep away from idling vehicles, and follow instructor guidance for students with respiratory conditions.
Protocol 4: Pedestrian-flow count
Question: How does foot traffic change by time of day, direction, and location on the block?
Materials: A tally counter or phone counting application, a printed data sheet, and a map of the block.
Protocol: Choose a crosswalk or sidewalk midpoint where the group can stand safely off the path. Count pedestrians for ten minutes in each direction. Repeat at three times of day and, if feasible, on a weekday and a weekend. Keep categories simple: pedestrian, cyclist, and other. Do not photograph faces or record identifying details.
Connect to regional data: Compare with municipal pedestrian counts, metropolitan planning organization datasets, and Census Bureau population and commuting data. OpenStreetMap can help document the street layout.
Safety: Stay off the roadway and out of bike lanes. Do not obstruct sidewalk flow. If the location feels unsafe, move to a different observation point.
Protocol 5: Shade and canopy audit
Question: How much shade does the block provide at midday, and where are the gaps?
Materials: A phone camera, an optional fisheye lens, a tape measure, and a printed block map.
Protocol: At ten marked points, photograph upward at a fixed orientation. Estimate canopy cover with a free image grid or a simple visual index. Measure the width of shade at noon along a transect. Note tree species if they can be identified confidently, and record whether shade comes from trees, awnings, or buildings.
Connect to regional data: Compare with municipal urban forestry inventories and the USDA Forest Service i-Tree Canopy tool. Local tree-planting plans may identify priority areas.
Safety: Do not enter private property without permission. Stay clear of traffic, and avoid measuring during storms or high winds.
Sharing data without oversharing
A class dataset becomes more valuable when it is documented. Use a CSV file with column names, units, date, time, location rounded to an appropriate precision, instrument model, calibration notes, and a missing-data code. Deposit the file in a repository such as OSF or Zenodo and assign a license, commonly Creative Commons Attribution for the dataset. Cite the regional datasets used for comparison. Remove faces, license plates, and any details that could identify a private individual. If a location is sensitive, aggregate results to the block level. With modest preparation, a sidewalk exercise can become a reusable teaching resource and a small contribution to public science.